Have you ever wondered how the levels of CBD, THC and other cannabinoids in cannabis or CBD oils are determined? In this post we're going to explain the science behind the methods used to quantify cannabinoids, such as gas chromatography, HPLC and mass spectrometry, and how these techniques are used together to analyse the components of cannabis.
Introduction to cannabinoid analysis
Cannabinoid analysis is used for a variety of purposes, both therapeutic and regulatory. Its main purpose is to determine the potency and quality of cannabis products, but it can also be used to legally classify a sample as “hemp” or “cannabis” based on its THC content. This makes it a very useful tool both for consumers and for professionals in the cannabis industry.
What are cannabinoids and how does the plant produce them?
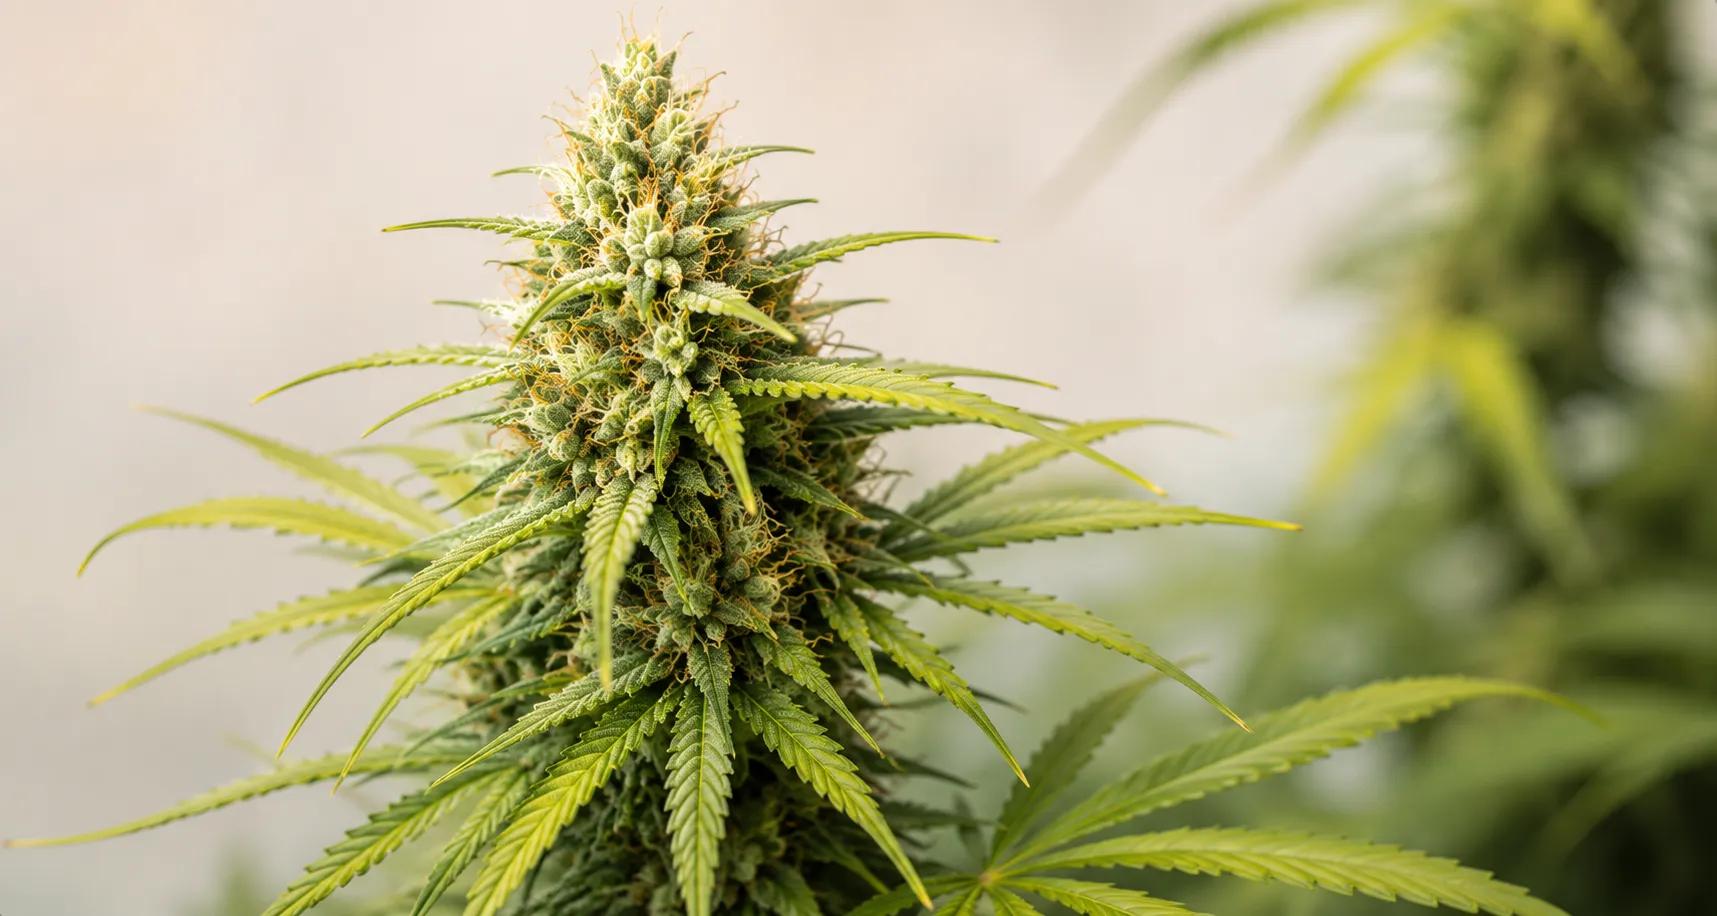
Cannabinoids are a type of chemical compound found predominantly in the Cannabis sativa plant. They are formed in the trichomes, tiny glandular structures found mainly on the cannabis flowers of female plants, better known as buds.
One particular feature of cannabinoids is that they are produced by the plant in their acid form, shown by an “A” at the end of the abbreviation. That is why some of the best-known acidic compounds are Δ-9-tetrahydrocannabinolic acid (THCA) and cannabidiolic acid (CBDA).
When cannabinoids are heated, they change into their neutral forms, the cannabinoids we all know or the most popular ones, such as tetrahydrocannabinol (THC) and cannabidiol (CBD). This happens on heating, as they lose carbon dioxide (CO2), in a process called decarboxylation.
These acidic and neutral forms of cannabinoids can be measured in different ways, and in this article I'll explain some of them to you.
Understanding chromatography: a key tool in cannabinoid analysis
What is chromatography?
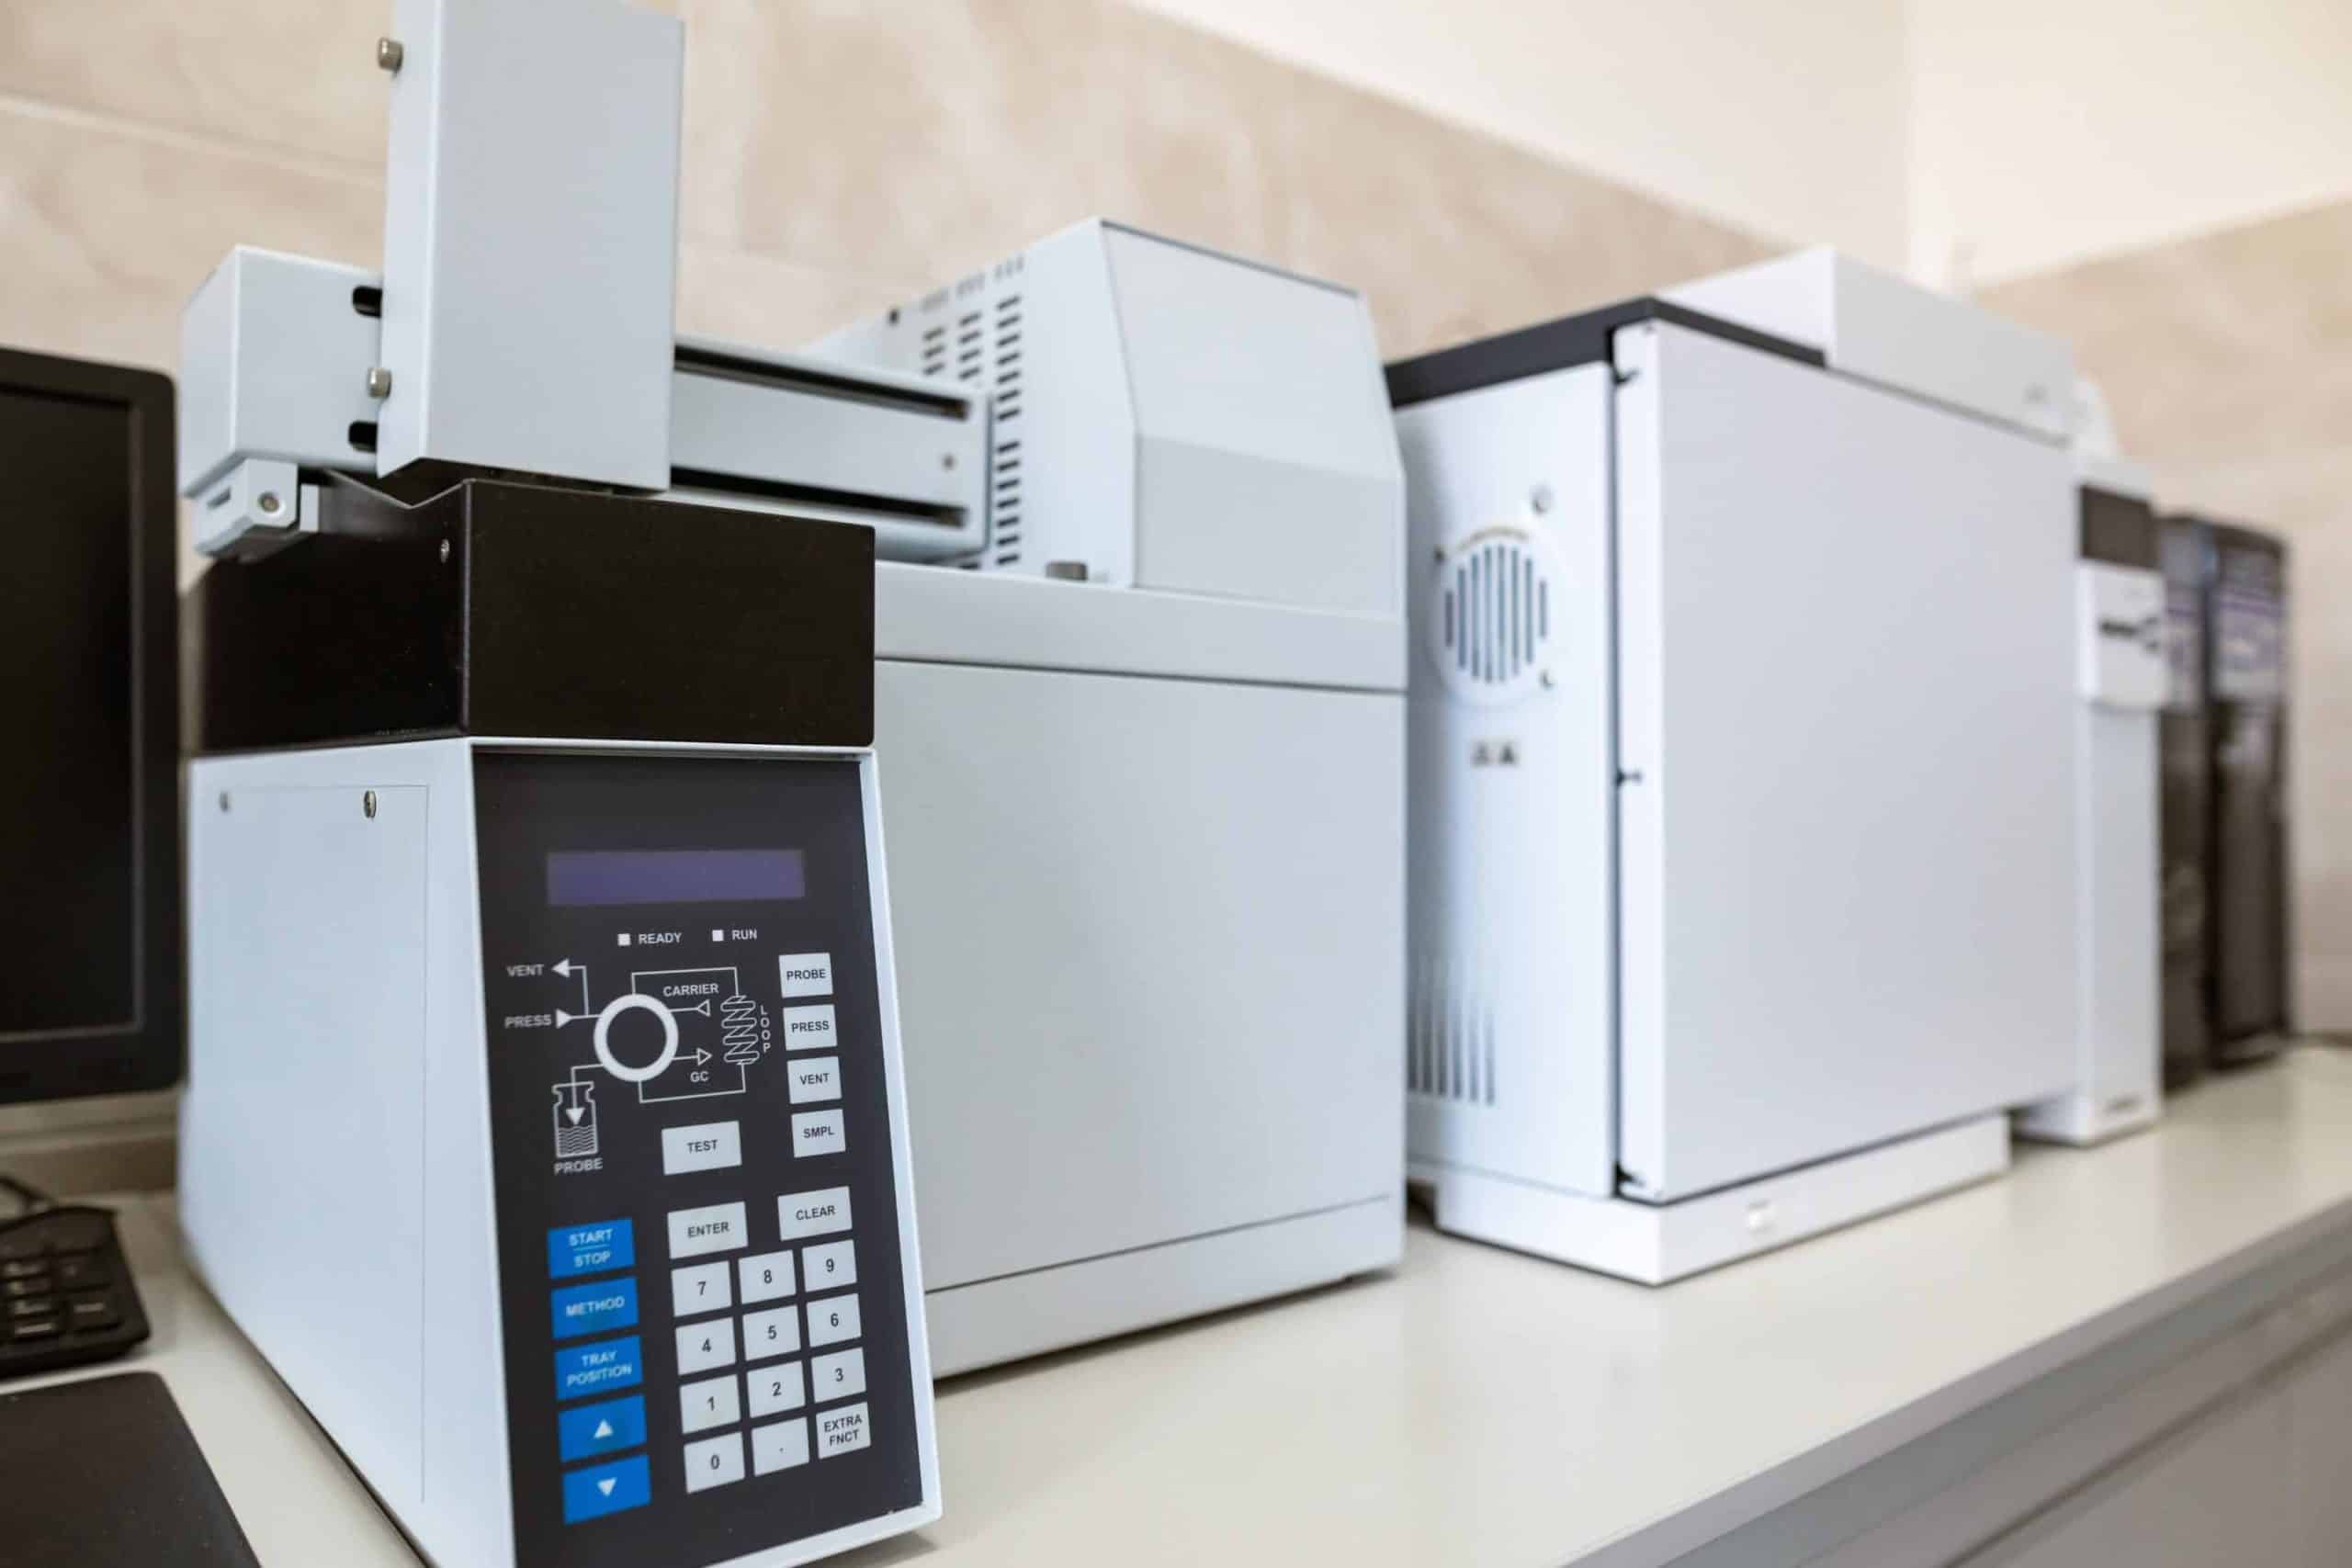
One of the most common ways of measuring cannabinoids in their acidic and neutral forms is chromatography. Chromatography is a separation technique, carried out in laboratories with specialised equipment, in which the analytes or chemical compounds that make up a sample are isolated so that they can be identified.
To understand it better, we can picture chromatography as a race. The “track” is the stationary phase, which doesn't move and over which the mixture we want to analyse passes. The “runners” are the mobile phase, which moves along the track or stationary phase. Cannabinoid substances, like the runners, move differently depending on their physical properties: some stick more to the stationary phase and move more slowly, separating from those that move faster (different retention time). The same would happen in the race analogy: as the runners make their way along the track, they gradually spread out according to their fitness.
How chromatography works
- Sample preparation: All chromatography starts with a mixture, which will be the mobile phase. This is made up of a solvent fluid (which can be a liquid or a gas) and, in the case of cannabis, the mixture will be made up of the cannabis flowers, the CBD oil, sweets or any other product we consume and whose cannabinoids we want to identify and quantify; in this case these are called analytes. The analytes are the components to be analysed, the compounds that are separated and measured during chromatography. (The same technique is used to identify terpenes, flavonoids and other compounds, but that's a story for another article.)
- Injection: The sample is pumped under pressure through a column made of a solid or semi-solid material (stationary phase).
- Separation: Each of the components of the sample differs in its flow rate, size and polarity, which causes them to separate as they flow through the column (some stick more than others).
- Detection: As the separated components leave the column, they pass through a detector that records how much of each one comes out. This is usually done by measuring the amount of ultraviolet light each component absorbs.
- Data analysis: The separated components are detected and recorded on a computer, which produces a graph called a chromatogram; interpreting it allows the different cannabinoids present to be accurately identified and quantified.

Gas chromatography: analysing cannabinoids in their neutral form
Gas chromatography (GC) uses gas as the mobile phase, and separation takes place in a column, which can be a capillary tube. This technique requires heaters to keep the sample uniform along the capillary column.
Gas chromatography can only measure cannabinoids in their neutral form.
Because the sample has to be heated, GC causes the decarboxylation of cannabinoids in their acid form. So when cannabinoids are assessed with this technique, it can only be done with the neutral cannabinoids, as the heat decarboxylates the acid forms. This may be one of the drawbacks of gas chromatography.
High-performance liquid chromatography (HPLC): measuring cannabinoids in acidic and neutral form
Liquid chromatography uses a liquid mobile phase, and a column can also be used. In the cannabis industry, one of the most widely used techniques is high-performance liquid chromatography (HPLC), in which very small particles are packed at high pressure.
Unlike gas chromatography, liquid chromatography doesn't require the mixture to be heated, so it can be used to measure the concentration of different cannabinoids, such as CBD and THC, even in their acid form. This makes it the preferred method of analysis for cannabis products.
In HPLC, pumps are used to push this pressurised liquid (solvent), which contains the mixture to be analysed, through the HPLC column. Each of the components of the sample differs in its flow rate, which causes them to separate as they flow through the column.
Interpreting the results of an HPLC cannabinoid analysis
The figure below shows the result of a cannabinoid analysis using HPLC [1]. This type of graph, called a chromatogram, shows time on the X-axis and the intensity of the detector signal on the Y-axis. Each peak on the graph represents a different component of the sample, and the area under the peak can be used to determine the amount of that component in the sample.
The X-axis (horizontal axis) shows the separation time of each analyte, so the unit is minutes. As you can see, each of the analytes, which in this case are cannabinoids, differs in the time (the number of minutes) it takes to pass through the liquid phase.
The Y-axis (vertical axis) represents the signal intensity, a measure of absorbance whose unit is the AU (absorbance unit), and it quantifies the amount of the analyte. This measurement comes from the amount of light absorbed, that is, how much light each of the analytes absorbs. The higher the peak on the Y-axis, the greater the intensity, so the more of that analyte is present in the sample and the larger its area under the curve. In the figure below, the unit on the Y-axis is mAU (milli-absorbance units), which is one thousandth of an absorbance unit.
Each cannabinoid has its own retention time, which allows us to tell them apart in a chromatography. The higher the peak, the higher the concentration of that cannabinoid in the sample.
So the result of the chromatography tells us, at a given time (X-axis), whether an analyte is (or isn't) present at a particular intensity (Y-axis). In our case, each cannabinoid has its own retention time, and the more of that particular cannabinoid there is in the sample, the higher the value on the Y-axis.
That is why, to tell each of the cannabinoids apart in the chromatogram, you need a standard to know the specific retention time of each of the analytes (cannabinoids). The Y-axis is a fluorescence measurement unique to each cannabinoid, which is why a standard is needed, as a guide, to know which cannabinoid falls under that particular peak.

It took me quite a while to work out what the first two peaks in the figure above represent, and I had to ask colleagues who are experts in the field. They explained that the first peak, which has no name in the figure, is produced by the injection of the liquid phase and corresponds to the molecules that don't interact in the column; it's called the solvent front.
The initial time before the solvent front peak is the time this mobile phase needs to pass through the column, and it's called the dead volume.
The second peak, labelled “I.S” in the figure, is that of the standard (internal standard, IS), which in the article's case was 4-androstene-3,17-dione. The peak of this chemical compound in the chromatogram serves as a reference for calculating the amount of cannabinoids present in the sample.
Mass spectrometry (MS): determining the molecular weight of cannabinoids
Mass spectrometry (MS) separates particles such as atoms and molecules by distinguishing the ratios of their charge to their mass. This technique is used to determine the weight of particles, and it is an analytical tool that measures the mass-to-charge ratio (m/z) of one or more molecules present in the sample.
These measurements can be used to calculate the exact molecular weight of the components of the sample. Mass spectrometry can identify unknown compounds by determining their molecular weight, and it is also used to quantify known compounds and to determine the structure of the components and molecules present.
Combined GC-MS: improving accuracy in determining cannabinoids
One of the most widely used techniques today for determining cannabinoids is the combination of gas chromatography with mass spectrometry (GC-MS).
This combines the ability of gas chromatography to separate the components of a sample with the ability of mass spectrometry to identify and quantify the individual components. The result is highly sensitive and accurate when it comes to measuring the amount and type of cannabinoids present in the sample.
In conclusion…
Well, here's the basic information on the different techniques currently used to measure cannabinoids in the cannabis industry. If any chemists are reading, I'd love to know what you think of this basic chemistry information.
References
- Gul, W., et al., Determination of 11 cannabinoids in biomass and extracts of different varieties of Cannabis using high-performance liquid chromatography. Journal of AOAC International, 2015. 98(6): p. 1523-1528.